
ROC Trading Strategies
Technical Analysis Indicators & Strategies • 8 min
The stochastic indicator is one of the most powerful and commonly used technical analysis tools. It belongs to the momentum oscillators group of indicators that help traders establish overbought and oversold conditions in the market. Other indicators that belong to this group include the RSI, MACD and TRIX. Stochastics was developed in the 1950s by George C. Lane, and its purpose is to assess the momentum of an asset’s price as well as the overall strength of the prevailing trend. As a measure of price momentum, the stochastic indicator can be very versatile in its functionality. In trending markets, it can warn of potential retracements or even reversals; and in ranging markets, it can tell when the underlying trend strength is fading. This makes stochastics a handy technical analysis tool in all market conditions to help pick out trading opportunities in the perpetual cycles of an asset’s price.
The stochastic indicator features two lines (%K and %D) that are calculated as follows:
%K = [(Current Close – Lowest Low n periods ago) / (Highest High n periods ago – Lowest Low n periods ago)] * 100
%D = 3-period moving average of %K
The default n period on most trading platforms is 14, but traders can choose their desired time period against which they wish to assess price behaviour. Generally, a smaller n will result in a stochastic that will react faster to price changes, but this may also generate an unreliable signal in some instances. On the other hand, a bigger n will result in a stochastic that reacts slowly to price changes, but the trading signals generated will be more reliable. Also, %K will be faster than %D (its moving average).
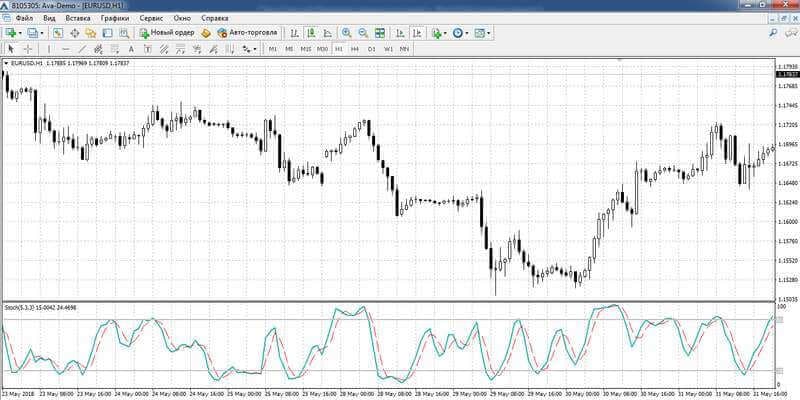
The two stochastic lines oscillate between 0 and 100. The indicator has two distinct lines drawn at values ‘20’ and ‘80’. The values denote oversold and overbought conditions in the market, respectively. George Lane pointed out that in the market, price follows momentum. Therefore, when prices are in overbought territory, traders can look to sell when the %K line crosses the %D line downwards. Similarly, when prices are in oversold territory, traders can seek buy opportunities when the %K line crosses the %D line upwards.
The above interpretation is ideal in ranging markets. Traders must be wary of stochastic signals in markets that trend strongly because indicator values can stay for prolonged periods in overbought and oversold conditions. Traders also watch the stochastic centreline (value 50) because it tells whether the prevailing trend is momentous or not. A bullish trend is qualified as momentous if the stochastic reading is above 50; whereas a bearish trend is qualified as momentous if the stochastic reading is below 50. Beyond the indicator reading, traders can also watch out for stochastic divergences to pick out lucrative trading opportunities in the market.
Here is how to trade the signals generated by the stochastic indicator:
The stochastic indicator is at its best when combined with other technical analysis tools. Here are some of the best combinations:
Here are some benefits of trading our wide choice of assets on AvaTrade platforms:
The stochastic indicator has become so popular because it is a good trading tool. In addition to being easy to read, it is also highly accurate, and many traders have benefitted from the information gained by adding the stochastic indicator to their charts. Over the years there have been a number of variants that have been developed to improve on the original stochastic indicator, but for the most part traders can remain with the original and feel confident that it will be both reliable and accurate.
Both the stochastic indicator and the relative strength index (RSI) are momentum oscillators. That makes them quite similar in their objective, with both being used to identify and forecast market trends. Even though they have a similar objective, each arrives there in a quite different way. The stochastic indicator works based on the assumption that closing prices should be moving in the same direction as the underlying trend. The RSI uses the velocity of price movements to determine when price is overbought or oversold. Both are useful, although the stochastic indicator tends to be better in sideways and choppy markets, while the RSI is preferred for trending markets.
The stochastic indicator and the MACD are both oscillators, and have a similar objective, although they arrive at that objective in different ways. Because of this the stochastic indicator tends to be better in sideways, ranging markets and the MACD tends to be a better indicator in trending markets. To get an even better signal the two indicators can be combined. It has been noted that if there is a stochastic crossover followed shortly after by a MACD crossover it is a very strong signal that a trend is forming.
See a trading opportunity?
Open an account now!
** Disclaimer – While due research has been undertaken to compile the above content, it remains an informational and educational piece only. None of the content provided constitutes any form of investment advice.
Technical Analysis Indicators & Strategies • 8 min

Technical Analysis Indicators & Strategies • 10 min

Technical Analysis Indicators & Strategies • 13 min

Technical Analysis Indicators & Strategies • 8 min

Technical Analysis Indicators & Strategies • 8 min

Technical Analysis Indicators & Strategies • 8 min

Technical Analysis Indicators & Strategies • 9 min

Technical Analysis Indicators & Strategies • 8 min

Technical Analysis Indicators & Strategies • 8 min

Technical Analysis Indicators & Strategies • 15 min

Technical Analysis Indicators & Strategies • 14 min

Technical Analysis Indicators & Strategies • 8 min

Technical Analysis Indicators & Strategies • 7 min

Technical Analysis Indicators & Strategies • 8 min

Technical Analysis Indicators & Strategies • 7 min

Technical Analysis Indicators & Strategies • 8 min

Technical Analysis Indicators & Strategies • 9 min

Technical Analysis Indicators & Strategies • 8 min

Technical Analysis Indicators & Strategies • 10 min

Technical Analysis Indicators & Strategies • 8 min